Understanding Forward P/E vs. Trailing P/E: Key Differences Explained
If you're trying to down and invest in stock, you will have probably come across the Price-Earnings or P/E ratio, as it is commonly referred to, which becomes the ratio between a firm's stock price and its earnings per share. This becomes crucial in stock analysis and investment decisions. And there are two types of this ratio-too-Forward P/E and Trailing P/E. So what is the difference between the two and when should which be used? This is what we are going to find out in the details now.
What is the P/E ratio?
A Price-Earnings ratio shows how much investors are willing to pay per dollar of earnings of a company. For instance, if a company has a P/E of 20, it shows that the investors are ready to pay 20 currency units per dollar of worth that the company makes. This ratio mainly helps the investors find out if a certain stock is undervalued or overvalued in relation to its earnings.
What is Trailing P/E?
Trailing P/E, also known as historical P/E, uses the actual earnings that a company has reported over the prior 12 months (TTM-trailing twelve months). This variation of the P/E ratio employs these previously revealed financial results of the company.
Advantage of Trailing P/E:
Trailing P/E is based on factual, historical data, thereby giving a vivid picture of a company's previous performance. It enables investors to compare the company's past performance over a period of time.
Disadvantage of Trailing P/E:
This metric will matter less, as it were, when the company is rapidly changing. In case of a big earnings fluctuation, it does not correctly reflect the current expectation for the company's future performance.
What is Forward P/E?
As opposed to Trailing P/E, Forward P/E is used to describe an expected prospective price. This is calculated on the basis of the earnings anticipated to accrue in the company's account in the next 12 months. These predictions are done by analysts on the basis of company forecasts.

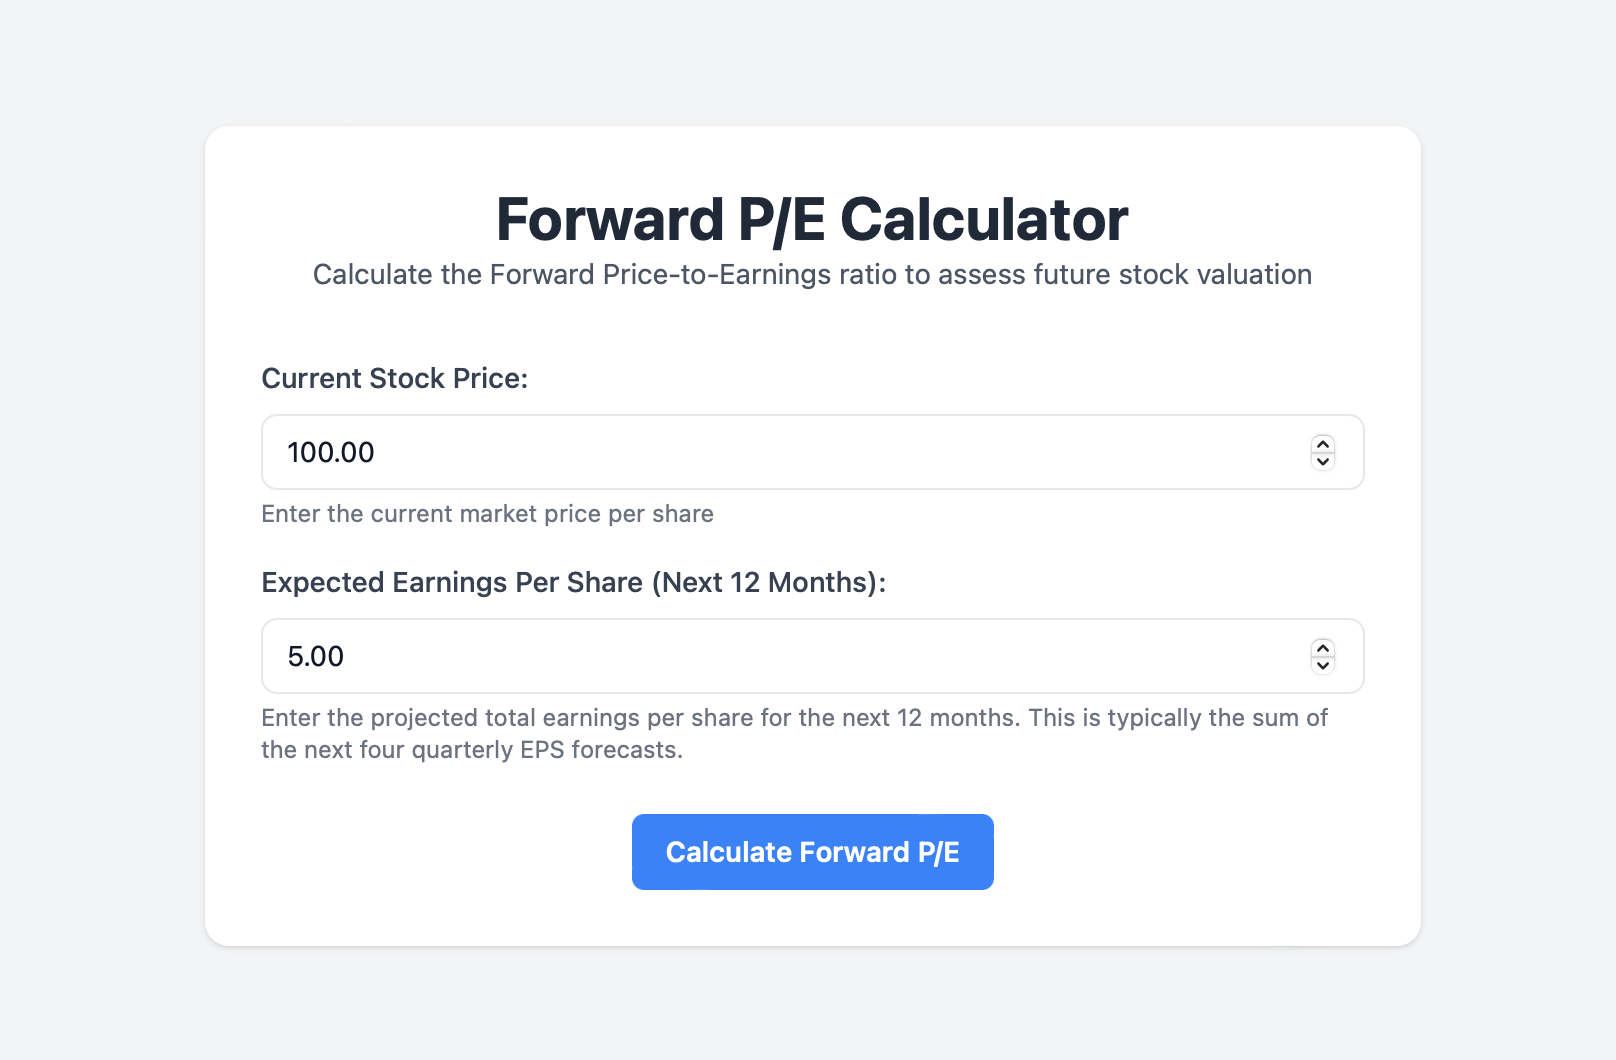
Forward P/E calculator
Try our forward P/E calculator to get a better understanding of a company's future potential.
Try tool for free
Among Forward P/E Advantages:
This ratio gives a more detailed overview of how a company will perform in the future as this ratio would fit growth companies to some extent.
Among Forward P/E Disadvantages:
As this is based on estimating, Forward P/E may at times provide an imprecise value. Varying analyst estimates lets a certain degree of distinctiveness enter the equation. If the guidance earnings fail, Forward P/E may give a misleading impression.
When to use Trailing P/E and when to use Forward P/E?
For those who favour established companies with stable earnings, Trailing P/E is best suited to these companies. Their historical records give a reliable lead to the future performance.
Use of the Forward P/E may thus be advantageous if one wants to analyze growth companies whose earnings are expected to grow enormously. This gives a better insight into the future potential of such a company.
Practical Example
Assume Company ABC, which made $5 per share in earnings over the past year and is currently trading at $100. Its Trailing P/E would be:
Trailing P/E = 100 / 5 = 20
Assuming analysts anticipate that the company will have earnings of $8 per share in the next year, the Forward P/E would be:
Forward P/E = 100 / 8 = 12.5
This example endeavors to show the Trailing P/E suggests that the stock is somewhat pricey. The Forward P/E indicates that if the earnings predictions remain, the investment should be positively inclined.
Further Reading and Resources
For an advanced understanding of P/E ratios and metrics of stock valuation, the following sources are recommended:
- Forward P/E Explained: A detailed explanation of the calculation and meaning of forward P/E
- Deep Dive into Trailing P/E: All about Trailing P/E and How to Perform Historical Earnings Analysis
Conclusion
In a nutshell, the main difference between the Forward P/E and the Trailing P/E is that the former focuses on the expected future earnings, while the latter is in conformity with past earnings. Both have their pros and cons and need consideration in light of two different investments, which will, in this case, be considered as potential buy and sell. A holistic perspective could be derived by juxtaposing the two.